With no offense intended to Senator McCain, I remember the real Original Maverick. I also have fond memories a true American (100%) Maverick. I'm kind of surprised that neither side has found a way to use one of the historical Mavericks to their advantage. Of course it could have something to do with the fact that no one under thirty has ever heard of them. I know my students (and younger colleagues) had no idea what I was talking when I made reference to them.
I don't know what the Original Maverick is up to these days, but I know which side he used to be on.
Tuesday, October 28, 2008
Friday, October 24, 2008
The Jewish Vote
John Sides has a new post over at The Monkey Cage on the levels of support for Obama among Jewish voters. One question that has come up during the campaign is whether Jewish voters will support Obama to the same degree that they have previous Democratic nominees. The data John cited are from Gallup tracking polls taken from October 1-21 and suggest that Jews are pretty firmly in the Obama camp (74%). While I have no reason to doubt that Jewish support for Obama was high in the early part of October, I'd be interested in seeing what the trend is like, especially in the last couple of weeks.
On October 14, a columnist for the New York Post reported that Jesse Jackson, while speaking at a conference in France, said that "Zionists" would lose their control of U.S. foreign policy under an Obama administration. The story was soon picked by CNN and Jesse Jackson was back in the news for a few days. Who better than Jesse Jackson to drive a wedge between Jewish voters and Barack Obama? Is it possible that the coverage of Jackson's comments had an effect on Jewish support for Obama?
One of the difficulties with assessing Jewish support over the course of the campaign is that data are hard to come by (at least until the election is over). Prior to seeing the Gallup poll I had scoured most of the national polls on Pollster.com looking for religious breakdowns and came up empty--almost. The IBD/TIPP tracking poll provides five-day rolling averages across multiple demographic categories, including religious affiliation. IBD/TIPP doesn't provide the sample sizes for subgroups but the number of Jewish respondents in each survey is not doubt very small, given that the Jewish vote accounted for only 3% of the electorate in 2004. With that in mind, and bearing in mind also that these data come from just one source, the graph below tracks the Jewish vote over the last couple of weeks.
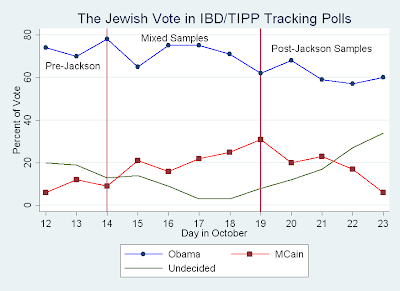 Although Jewish voters clearly favor Obama, their level of support averaged over the entire time period (67.8%) is somewhat lower than the 74% given to John Kerry in 2004. Before the Jackson comments got attention, Obama averaged 74% of the vote (the same as the Gallup results); in the middle period, when the polling samples included some days before and some days after the airing of Jackson's comments, Obama averaged 71.4%; and in the last period, when all of the samples were taken after Jackson's comments came out, Obama averaged 61.2%. Interestingly, while McCain seemed to initially benefit from the decline in Obama's support, there was a real up tick in undecideds in the last period.
I don't want to make too much of this, as I only have a few data points, from small samples, taken over a short period of time. If anyone has access to other data that might shed more light on this, please feel free to share.
Wednesday, October 22, 2008
Electoral College Update
Jay's latest update to our Electoral College forecast (right panel) switches West Virginia from Obama to McCain. To be honest, I was a bit squeamish about having it in the Obama column but that's what the model dictated, until today. As it stands right now, North Carolina is teetering and could switch to Obama with a few more polls showing him ahead, and West Virginia could move back to Obama if the polls there reverse course. Other than that, though, I don't see many sates as likely to switch between now and election day.
Friday, October 17, 2008
Wisconsin Survey
This semester I'm coordinating a small group of seniors in our new Undergraduate laboratory for the Empirical Analysis of Politics (ULEAP), and I'm also teaching freshman seminar titled, Politics by the Numbers. Both groups of students, along with me and my capable T.A., Aaron Weinshenck, have just completed a survey of Wisconsin voters.
The Survey was conducted from October 8 to October 15, using the CATI lab at the Center for Urban Initiatives and Research (CUIR). There were a total of 434 completed interviews (392 of whom answer the vote question), for a margin of error of appr0ximately +/-4.7 percentage points (+/- 5.0 points for the vote question). The sample was weighted to reflect the distribution of sex, age, and party identification in the Wisconsin electorate, as reflected in exit polls from the 2004 and 2006 elections.
The results of the survey indicate a wide lead in the Badger state for Obama:
 Obama's margin of 15 points is wider than most polling in Wisconsin this fall, but is very close to the 17 point spread in a recent Quinnipiac poll.
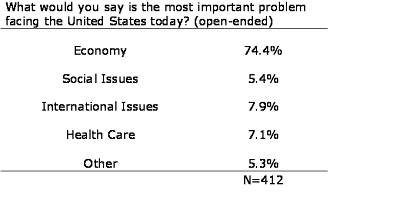
Why is Obama doing so well in Wisconsin? In a word, the economy. When responding to an open-ended "most important problem" question, Wisconsinites overwhelmingly identified the economy:
 When asked which candidate would do a better job handling the most important problem, respondents gave Obama a decided advantage:
 When asked more directly to evaluate the state of the economy responses were almost uniformly negative:
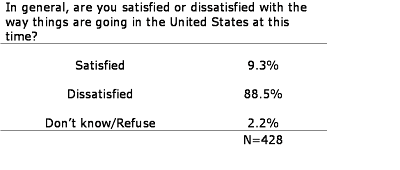
 Respondents were also decidedly gloomy when asked about general satisfaction with "the way things are going" in the country:
 As expected given the nature of these findings, Wisconsin residents view President Bush's job performance negatively:
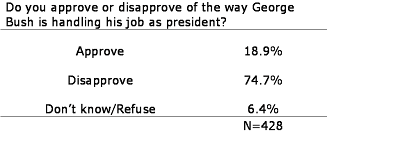 In Wisconsin, as in the rest of the county, the levels of economic pessimism, dissatisfaction with the direction of the country, and negative evaluations of the president create a hostile environment for the incumbent party candidate, John McCain.
The Survey was conducted from October 8 to October 15, using the CATI lab at the Center for Urban Initiatives and Research (CUIR). There were a total of 434 completed interviews (392 of whom answer the vote question), for a margin of error of appr0ximately +/-4.7 percentage points (+/- 5.0 points for the vote question). The sample was weighted to reflect the distribution of sex, age, and party identification in the Wisconsin electorate, as reflected in exit polls from the 2004 and 2006 elections.
The results of the survey indicate a wide lead in the Badger state for Obama:
 Obama's margin of 15 points is wider than most polling in Wisconsin this fall, but is very close to the 17 point spread in a recent Quinnipiac poll.
Why is Obama doing so well in Wisconsin? In a word, the economy. When responding to an open-ended "most important problem" question, Wisconsinites overwhelmingly identified the economy:
 When asked which candidate would do a better job handling the most important problem, respondents gave Obama a decided advantage:
 When asked more directly to evaluate the state of the economy responses were almost uniformly negative:
 Respondents were also decidedly gloomy when asked about general satisfaction with "the way things are going" in the country:
 As expected given the nature of these findings, Wisconsin residents view President Bush's job performance negatively:
 In Wisconsin, as in the rest of the county, the levels of economic pessimism, dissatisfaction with the direction of the country, and negative evaluations of the president create a hostile environment for the incumbent party candidate, John McCain.
Sunday, October 12, 2008
Forecasting the Electoral College with October Data
As promised in my last post on the September Model I'm be posting a rolling Electoral College forecast (in the panel to the right), based on past election results and October national and state-level trial-heat polls. As with the September model, these state-level forecasts were developed with Jay DeSart. Clicking on to map to the right will take you to Jay's web page, where more details are available. As new polls come in the forecast will change, so please check in on on a regular basis for changes.
The results for today are:
The results for today are:
- Electoral vote: Obama 354, McCain 184
- National popular vote: Obama 52.85%, 47.15%
Wednesday, October 8, 2008
Electoral College Forecast--September Polls
Back in April I wrote a post about using September polls to forecast election outcomes in the states. The general finding from the work I've done with Jay DeSart is that candidates generally win states in which they hold a lead in September polls and always win when they lead outside the margin of error. Jay and I use this information, along with a lagged vote variable and a control for national trial-heat polls in a state-level forecasting model.
Jay has done the heavy lifting on this model and has posted the details of the 2008 forecast on his web page. The results are summarized in this map.

Based on the September Poll Model, we project an Obama Electoral College win with 336 votes to McCain's 202 votes. Projecting the national popular vote based on predicted state margins and assumed state-level contributions to the national vote, we get Obama with 51.8% of the two-party vote.
Coming attraction: We will soon be unveiling an October Model that tracks changes in projected electoral votes as new polls come out.
Update: Missouri but not Virginia? Several readers have asked in comments why we are calling Missouri but not Virginia for Obama. Good question. The short answer is because that's what the model projects. Sometimes when you run a model like this you get results that make you scratch your head and wonder what's going on. But if you look under the hood of the model, it's somewhat easier to understand.
As described above, the model considers two state-level variables, the average poll result from September and a lagged vote variable from previous elections (averaged over four prior elections). On the lagged vote variable, Democrats have done better in Missouri than in Virginia, so this would push it toward the Obama column. On the poll variable, Obama did better in Virginia than in Missouri but not by enough, given Virginia's voting history to call the state in his favor. While Obama was leading in Virginia polls by the end of the month, he trailed McCain earlier in the month, and the month-long average was just about dead even. In the end, the data from September polls and lagged votes together pushed Missouri just into the Obama column and Virginia just into the McCain column.
No doubt part of the surprise here is due to Obama's strong performance in recent polls in Virginia. But remember, his biggest gains have come in the first week and a half of October and are not incorporated in this model. As promised, an October model is coming soon to a blog near you!
Jay has done the heavy lifting on this model and has posted the details of the 2008 forecast on his web page. The results are summarized in this map.
Based on the September Poll Model, we project an Obama Electoral College win with 336 votes to McCain's 202 votes. Projecting the national popular vote based on predicted state margins and assumed state-level contributions to the national vote, we get Obama with 51.8% of the two-party vote.
Coming attraction: We will soon be unveiling an October Model that tracks changes in projected electoral votes as new polls come out.
Update: Missouri but not Virginia? Several readers have asked in comments why we are calling Missouri but not Virginia for Obama. Good question. The short answer is because that's what the model projects. Sometimes when you run a model like this you get results that make you scratch your head and wonder what's going on. But if you look under the hood of the model, it's somewhat easier to understand.
As described above, the model considers two state-level variables, the average poll result from September and a lagged vote variable from previous elections (averaged over four prior elections). On the lagged vote variable, Democrats have done better in Missouri than in Virginia, so this would push it toward the Obama column. On the poll variable, Obama did better in Virginia than in Missouri but not by enough, given Virginia's voting history to call the state in his favor. While Obama was leading in Virginia polls by the end of the month, he trailed McCain earlier in the month, and the month-long average was just about dead even. In the end, the data from September polls and lagged votes together pushed Missouri just into the Obama column and Virginia just into the McCain column.
No doubt part of the surprise here is due to Obama's strong performance in recent polls in Virginia. But remember, his biggest gains have come in the first week and a half of October and are not incorporated in this model. As promised, an October model is coming soon to a blog near you!
Thursday, October 2, 2008
Election Forecasts
A new symposium on forecasting the 2008 presidential election is now available online in PS:Political Science and Politics. This is a collection of forecasts from several political scientists, including me. The crucial table (below, click on it to make it easier to read) comes from Jim Campbell's introductory essay. Campbell summarizes each author's model, prediction, and level of certainty.

All of the forecasts are based on the percent of the two-party vote predicted for the incumbent presidential party, so the predictions are for McCain's share of the two-party vote.
A couple of things are worth noting. First, there is quite a range in predicted outcomes, from a low of 41.8% (Brad Lockerbie) to a high of 52.7% (Jim Campbell), with a median forecast of 48.0% for McCain. My own national forecast (my state-level model depends upon September polls and is not yet ready) is for McCain to get 44.3% of the two-party vote, so I'm a bit on the low end. Second, while there is a lot of diversity among the models every one except Norpoth's includes at least one retrospective variable, such as presidential approval or some measure of economic performance.
So, what should we make of these predictions? One interesting finding from the last several years of election forecasts is that while there is a lot of variation in error across models in any given year, almost every forecasting model has predicted correctly the eventual winner of the popular vote. In fact, going back as far as 1996 I calculate that leading forecasters (mostly published in PS, as well as a couple of other prominent models) called the correct popular vote winner in 27 out of 28 cases . In addition--and I'm not sure how to explain this, or what type of bias it might imply--in 25 out of 28 cases, the models overestimated (sometimes slightly, other times by a wide margin) the share of the vote going to the incumbent party. These two findings, combined with the direction of the forecasts posted above, would seem to suggest dim prospects for the McCain campaign.
For what it's worth McCain's share of the two-party vote in current polls is 46.4%.
Subscribe to:
Posts (Atom)

