The first of three presidential debates is scheduled for this Friday, the 26th of September. We can expect to see the two campaigns positioning themselves and trying to manipulate (lower) expectations in the coming days, and we can also expect the media to focus on how pivotal the debates might be to determining the contours of the remaining weeks of the campaign. These things will happen because of the high visibility nature of these one-night events and the relatively high stakes if one side or another does a lousy job.
But do debates really have much of an impact on the campaign? Are elections won or lost because of debate performances? Is there much of a debate bump? In
Do Campaigns Matter? I argued that debates have relatively limited effects because they occur relatively late in the campaign, when opinions are less pliable, and because--unlike conventions--the information flow is relatively balanced, with both sides making their case.
As the debate period draws near, it is useful to look at data from past debates to get a sense of what to expect this year. In the figures and table below I use
Wlezien and
Erickson's
"poll of polls" to gauge relative support for the two major party candidates during the last sixty days of the campaign. The poll of polls measures the percent of the two-party vote for the incumbent party candidate in the latest available public opinion polls for any given date. These data allow me to examine the flow of public opinion during the fall campaign (figures) and also to measure candidate support in discrete periods of time before and after debates (table).
In the figure below every diamond-shaped dot represents a daily polling observation from the poll of polls; the smoothed line is a lowess estimate intended to give a better representation of the "bump and wiggle" of candidate support; and the vertical lines represent the dates on which debates occurred.
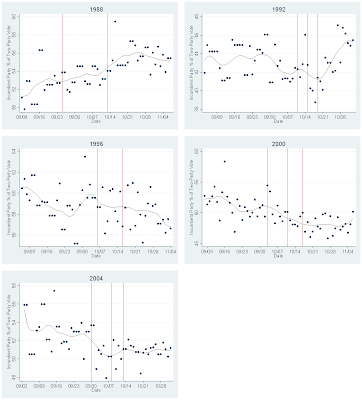
Theses figures provide a visualization of the debate effects and there are a few debates the "look" like they mattered. However, some of these visuals could be a bit deceptive because most of the x-axes only span about ten percentage points and also because some of the debates are closer together than others. The table below summarizes the information from the graphs in a way that gives us a firmer grip on the magnitude of the debate bumps. Here, I compare the polling average from six days prior to the debate to the day of the debate with the average from the seven days following the debate.

These data suggest that the norm is for very little swing in candidate support following debates. Across all thirteen presidential debates the average absolute change in candidate support was 1 percentage point. There are a few notable exceptions, of course. Two that stand out are the second debate in 1992, following which George H.W. Bush lost 2 points, and first debate of 2004, after which George W. bush lost 2.26 points. Other debates with above average ( but still small) vote shifts are the first debate in 1996 and the second debates in 1988 and 2000. Each of these debates has its own story, and I'm sure we can all think of anecdotes to explain the bumps and wiggles. Although the analysis is terribly outdated by now, the debate model from
Do Campaigns Matter? came to the profound conclusion that the candidate viewed as having won the debate generally gets a small bump (I told you it was profound).
Focusing on single debate bumps may be obscuring a more general, cumulative effect of debates. The last column in the table shows the change in candidate support from one week prior to the first debate to one week after the final debate. Here we see that the debate period generated a 2.42 point bump for George H. W. Bush in 1988, cost Al Gore 3.52 points in 2000, and cost George W. Bush almost 2 points in 2000. Of these, the 2000 debates stand out as the most important, especially in the context of the closeness of the election. Part of the explanation for Gore's swoon during the debate period is perhaps related to his performance but another important factor was the media meme that emerged as a result of the debates, including open discussions of whether or not Al Gore was a "serial exaggerator" (see
Jamieson and Waldman).
So what does this mean for the three presidential debates this year? I don't expect to see large swings in candidate support following the individual debates, barring something really spectacular happening. However, even relatively small shifts in the same direction over the three debates could make this relatively tight race even tighter (if the shifts favor McCain), or could blow it open (if the shifts favor Obama).
Note: I've made a minor change to the title of the table since the original post.


 Theses figures provide a visualization of the debate effects and there are a few debates the "look" like they mattered. However, some of these visuals could be a bit deceptive because most of the x-axes only span about ten percentage points and also because some of the debates are closer together than others. The table below summarizes the information from the graphs in a way that gives us a firmer grip on the magnitude of the debate bumps. Here, I compare the polling average from six days prior to the debate to the day of the debate with the average from the seven days following the debate.

 While the error in predicting the McCain bump is relatively small, the Obama prediction error is appreciably larger. The most likely explanation lies in the fact is that the Republican VP announcement took place the day after the Democratic convention and the Republican convention started (sort of--Gustav) the following Monday. In effect, Obama/Biden disappeared from media coverage the day after the convention, in contrast to a period of post-convention media coverage that typically (I think) tilts toward the convening party. It was also probably a mistake to wait until the Saturday prior to the convention to announce the Biden selection. Had this been announced on Wednesday or Thursday of the week before the convention, the Democrats would have gotten a couple of extra days of positive and abundant coverage heading into the convention.
